Essential Troubleshooting Manual for Kubernetes
I. Pod Related Issues and Troubleshooting
Pod Fails to Start, How to Identify the Cause?
- Use the
kubectl describe pod [pod_name] -n [namespace_name]command to view the status information of the Pod, check the container’s status and event information to determine if there are any issues. - Use the
kubectl logs [pod_name] -n [namespace_name]command to view the log information of the Pod container, check for any errors or exceptions. - Use the
kubectl get events --field-selector involvedObject.name=[pod_name] -n [namespace_name]command to view the Pod’s event information and check if any abnormal events have occurred.
Pod Fails to Connect to Other Services, How to Troubleshoot?
- Use the
kubectl exec -it [pod_name] -n [namespace_name] -- /bin/bashcommand to enter the container where the Pod is located, and try using commands likepingortelnetto test the network connectivity with other services. - Use the
kubectl describe pod [pod_name] -n [namespace_name]command to check theNetworkPolicyconfiguration of the Pod and determine if it is blocking access to other services. - Use the
kubectl describe service [service_name] -n [namespace_name]command to check the configuration and status information of the target service and determine if there are any faults.
Troubleshooting Slow or Abnormal Pod Performance
- Use the
kubectl top pod [pod_name] -n [namespace_name]command to check the CPU and memory usage of the Pod and determine if there are any performance bottlenecks. - Use the
kubectl exec -it [pod_name] -n [namespace_name] -- /bin/bashcommand to enter the container where the Pod is located, and use thetoporhtopcommand to check the CPU and memory usage of the processes inside the container, identifying possible bottlenecks. - Use the
kubectl logs [pod_name] -n [namespace_name]command to view the log information of the container in the Pod, searching for possible errors or exceptions.
Troubleshooting Pod Scheduling Failure
- Use the
kubectl describe pod [pod_name] -n [namespace_name]command to check the scheduling status of the Pod and determine if there are any resource shortage or scheduling policy issues. - Use the
kubectl get nodesandkubectl describe node [node_name]commands to check the resource usage of all nodes and identify if there are any resource shortage or faulty nodes. - Use the
kubectl describe pod [pod_name] -n [namespace_name]command to inspect the required labels and annotations of the Pod, as well as the labels and annotations of the nodes, to determine if they match.
Pod status remains Pending, what should I do?
- Use the
kubectl get pods -n <namespace>command to check the status and events of the Pod, to determine the current state and if there are any error or warning messages. - Check the description file of the Pod (YAML or JSON) to ensure that all fields, such as image name, resource requests, and ports, are correctly configured.
- If the Pod requires a specific type of node (such as a GPU node), verify if there are any available nodes in the cluster that meet the requirements.
- Check if the resource quotas for the Pod (such as CPU and memory) have reached their limits. You can use
kubectl describe pod <pod-name> -n <namespace>to view detailed information. - Verify if the required storage volumes for the Pod are available and ensure that there are no mounting errors.
- If it is a scheduling issue, you can resolve it by:
- Ensuring that there are enough node resources to meet the scheduling requirements of the Pod.
- Checking if the
taints and tolerationsof the node match the selector of the Pod. - Adjusting the scheduling strategy of the Pod, such as using
NodeSelectororAffinity.
Pod cannot access external services, what should I do?
- Verify if the DNS configuration in the Pod is correct.
- Check if there are any existing Service services in the namespace where the Pod is located.
- Confirm if the Pod has network access permissions.
- Check if the node where the Pod is located has external access permissions.
- Verify if the network policies are blocking the Pod from accessing external services.
Pod exits immediately after startup, what should I do?
- Check the event information of the Pod:
kubectl describe pod <pod-name> - Check the logs of the Pod:
kubectl logs <pod-name> - Verify if the container image is correct, environment variables are correct, and entry script is functioning properly
- Try running the container with the same image locally to see if there are any error messages, e.g., execute
docker run <image-name>
Pod is unable to run the application correctly after startup, what should I do?
- Check the application logs within the Pod:
kubectl logs <pod-name> - Check the event information of the Pod:
kubectl describe pod <pod-name> - Verify if the application’s configuration files are correct
- Verify if the application’s dependencies are functioning properly
- Try running the container with the same image locally to see if there are any error messages, e.g., execute
docker run <image-name> - Confirm if the application aligns with the resource limits of the Pod
Service in Kubernetes Cluster is not accessible, what should I do
- Check if the coreDNS service is available.
- Verify if the DNS configuration file is correct (/etc/resolv.conf).
- Ensure that the port of the service at the application layer is correct.
- Check if the service is properly associated with the backend pod.
- Verify if the business pod is functioning properly.
- Check if there are any issues with the CNI network components (flannel, calico).
- Ensure that the kube-proxy component is functioning correctly.
- Confirm if the relevant iptables rules or ipvs routes have been created.
Pod terminates immediately after startup or in CrashLoopBackOff state
- Use the
kubectl get pods -n <namespace>command to check the status and events of the pod and see if there are any errors or warnings. - Use the
kubectl logs <pod-name> -n <namespace>command to view the log output of the pod, paying particular attention to the last few lines for any error messages. - Verify if the lifecycle hooks of the pod (such as postStart, preStop) are properly configured and not causing any exceptions.
- Confirm if the commands or container startup commands executed by the pod are correct and not causing unexpected container exits.
- Check if the resource usage of the container exceeds the resource limits of the pod, especially the memory limit.
Issues with accessing internal services or network connections within a Pod
- Use the
kubectl get pods -n <namespace>command to check the status and events of the Pod, and see if there are any errors or warnings. - Ensure that the Service associated with the Pod has been created, and that it matches the port and protocol used by the Pod.
- Check the DNS configuration within the Pod to ensure that it can resolve the domain names of other services.
- Use the
kubectl exec <pod-name> -n <namespace> -- <command>command to enter the Pod and manually test the network connectivity between containers.
Issues between Pods and storage volumes
- Use the
kubectl get pods -n <namespace>command to check the status and events of the Pod, and see if there are any errors or warnings. - Confirm that the storage volume has been correctly bound to the Pod, you can use
kubectl describe pod <pod-name> -n <namespace>to view detailed information. - Use the
kubectl exec <pod-name> -n <namespace> -- <command>command to enter the Pod and manually test if the storage volume can be successfully mounted and accessed. - Check the configuration of the storage volume provider (e.g. NFS, AWS EBS) to ensure it is correct and available.
- Ensure that the storage volume access mode (e.g. ReadWriteOnce, ReadOnlyMany) matches the requirements of the application.
II. Node-related Issues and Troubleshooting
Troubleshooting Node Status Abnormalities
- Use the
kubectl get nodescommand to view the status and information of all nodes in the cluster to determine if there are any faults. - Use the
kubectl describe node [node_name]command to view detailed information about the target node, including CPU, memory, disk, and other hardware resource usage, to determine if there are any performance bottlenecks. - Use the
kubectl get pods -o wide --all-namespacescommand to view the status information of all pods in the cluster, to determine if there are any pods running on the target node causing resource constraints.
Troubleshooting Pods Running on Nodes Unable to Access the Network
- Use the
kubectl describe node [node_name]command to view information about the target node and check if it is properly connected to the network. - Use the
kubectl describe pod [pod_name] -n [namespace_name]command to view the node information on which the pod is running, to determine if network access failure is due to abnormal node status. - Use the
kubectl logs [pod_name] -n [namespace_name]command to view the logs of the pod container and look for possible errors or exceptions.
Node Unable to Access Storage, How to Troubleshoot
- Use the
kubectl describe pod [pod_name] -n [namespace_name]command to check thevolumesconfiguration of the Pod and determine if there is any storage mounting failure. - Use the
kubectl exec -it [pod_name] -n [namespace_name] -- /bin/bashcommand to enter the container where the Pod is located and try using commands likelsandcatto access the mounted file system and determine if there are any read/write errors. - Use the
kubectl describe persistentvolumeclaim [pvc_name] -n [namespace_name]command to view the configuration and status information of the relevant PVC and determine if there is any issue.
Storage Volume Mounting Failure, How to Handle?
- Use the
kubectl describe pod [pod_name] -n [namespace_name]command to check thevolumesconfiguration of the Pod and determine if there is any storage volume definition error. - Use the
kubectl describe persistentvolumeclaim [pvc_name] -n [namespace_name]command to check the status and information of the PVC and determine if there is any insufficient storage quota or storage resource failure. - If it is a network storage such as NFS or Ceph, ensure that the network connection is functioning properly and check if the storage server’s service is running properly.
Node cannot be scheduled after joining the Kubernetes cluster, what should I do
- Check if the taints and tolerations of the node match the selector of the Pod
- Check if the resource usage of the node meets the scheduling requirements of the Pod
- Ensure that the node has a proper connection with the Kubernetes API server
PersistentVolume mounting failure in the Kubernetes cluster, what should I do
- Check if the matching relationship between PersistentVolume and Pod is correct
- Check if the storageClassName in PersistentVolumeClaim matches the storageClassName of PersistentVolume
- Check if the node storage configuration and the definition of PersistentVolume are correct
- Ensure that the necessary permissions for the automatic provisioning layer are in place
III. Cluster-level Issues and Troubleshooting
Many Pods in the cluster are running slowly, how to troubleshoot
- Use the
kubectl top pod -n [namespace_name]command to view the CPU and memory usage of all Pods, and determine if there are any resource bottlenecks. - Use the
kubectl get nodesandkubectl describe node [node_name]commands to view the resource usage of all nodes, and determine if there is resource scarcity on a single node. - Use the
kubectl logs [pod_name] -n [namespace_name]command to view the logs of the Pod containers, and look for possible errors or exceptions.
A specific service in the cluster is not available, how to troubleshoot
- Use the
kubectl get pods -n [namespace_name]command to view the status information of the Pods related to the service, and determine if there are any faults. - Use the
kubectl describe pod [pod_name] -n [namespace_name]command to check for network connectivity and storage access issues of the Pod, and find the cause of the fault. - Use the
kubectl describe service [service_name] -n [namespace_name]command to view the configuration and status information of the service, and determine if there are any faults.
Node and Pod imbalance in the cluster, how to troubleshoot
- Use the
kubectl get nodesandkubectl get pods -o wide --all-namespacescommands to view the status information of all Nodes and Pods, and determine if there is an uneven distribution. - Use the
kubectl top pod -n [namespace_name]command to view the CPU and memory usage of all Pods, and determine if there are any resource bottlenecks causing the uneven distribution of Pods. - Use the
kubectl describe pod [pod_name] -n [namespace_name]command to view the information of the Node where the Pod is running, and use thekubectl describe node [node_name]command to view the status information of the relevant node, and determine if there is an imbalance in the nodes. - Use the
kubectl describe pod / node [node_name]command to check if there are any affinity or anti-affinity policies causing fixed scheduling on the current Pod / Node.
A specific node in the cluster is down, how to handle
- Use the
kubectl get nodescommand to check the node status and identify the problematic node. - Use the
kubectl drain [node_name] --ignore-daemonsetscommand to evict the Pods from the node and redeploy them to other nodes. Adding the-ignore-daemonsetsparameter will ignore DaemonSet resources. - If maintenance or hardware replacement is required for the node:
- First, mark the node as unschedulable with
kubectl cordon [node_name], then use thekubectl drain [node_name] --ignore-daemonsetscommand to evict the Pods from the node and redeploy them to other nodes. Finally, safely take the node offline withkubectl delete node [node_name].
Troubleshooting Kubernetes API Server Unavailability
- Use the
kubectl cluster-infocommand to check the cluster status and determine if the API Server is unavailable. - Use the
kubectl versioncommand to check the cluster version and confirm if the Kubernetes API Server and kubelet versions match. - Use the
systemctl status kube-apiservercommand to check the running status of the API Server and confirm if there are any faults or errors. - Combine with the logs at the system level on the node where the apiServer is located to further pinpoint the issue.
Dealing with Failed Kubernetes Commands
- Check if the Kubernetes API server is available:
kubectl cluster-info - Check if the current user has sufficient permissions for the cluster:
kubectl auth can-i <verb> <resource> - Check if the login information in the kubeconfig file is correct:
kubectl config view
Handling Unavailable Kubernetes Master Node
- Check if kube-apiserver, kube-scheduler, and kube-controller-manager are all running.
- Check if the etcd storage system is available.
- Try restarting the kubelet and container runtime on the master node.
What to do if the Kubernetes cluster bypasses the LoadBalancer and accesses the Pod directly
- Check if the communication between Service and Pod is using the ClusterIP type of Service
- Confirm if the selector of the Service matches the correct Pod
What to do if the automatic update of Deployment in the Kubernetes cluster fails
- Check if the update strategy is set correctly, such as
rollingUpdateorrecreate - Check if the connection between the Kubernetes API server and kubelet is functioning properly
- Check if the Pod definition is correct
What to do if there is a status check error in the Kubernetes cluster
- Check the node logs and event information, and identify the error type
- Confirm if the status check is compatible with the version of kubelet
- Try upgrading components such as kubelet and container runtime
What to do if there is a misconfiguration in the authorization settings of the Kubernetes cluster
- Check if the RoleBinding and ClusterRoleBinding definitions are correct
- Check if the roles bound to the user or service account are correct
- Check if the users and access permissions in the kubeconfig file are correct
Kubernetes cluster cannot connect to the etcd storage system, what should I do
- Check if the etcd storage system is running properly
- Verify the correctness of the etcd connection information in the kube-apiserver configuration file
- Try manually connecting to the etcd cluster by executing
etcdctl cluster-health
IV. Troubleshooting Pod Status Abnormalities
Generally, no matter what abnormal state a Pod is in, you can execute the following commands to view the status of the Pod:
kubectl get pod <pod-name> -o yaml     Check if the Pod's configuration is correct
kubectl describe pod <pod-name> -n <namespace>       View the events of the Pod
kubectl logs <pod-name> [-c <container-name>]     View container logs
These events and logs above usually help troubleshoot issues with the Pod.
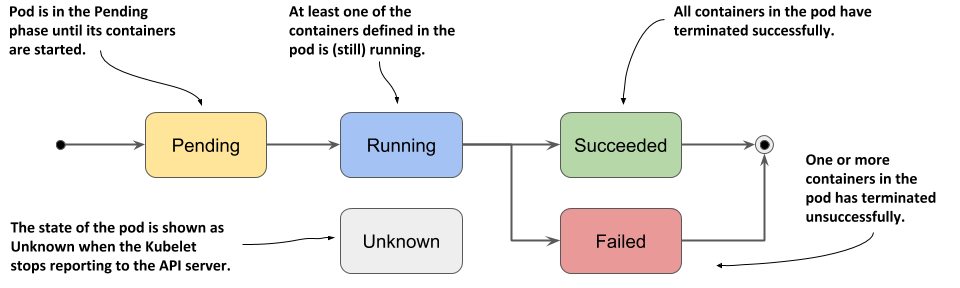
Pod Stuck in Pending State
Pending indicates that the Pod has not been scheduled to a Node yet. You can use the kubectl describe pod <pod-name> command to view the events of the current Pod and determine why it has not been scheduled.
Possible reasons include:
- Insufficient resources, where none of the Nodes in the cluster meet the CPU, memory, GPU, or other resource requests of the Pod;
- HostPort is already in use, and it is usually recommended to use a Service to expose the service port externally;
Pod is stuck in Waiting or ContainerCreating state
First, check the events of the current Pod by running the command kubectl describe pod <pod-name>. Possible reasons include:
- Image pull failure, such as:
- Incorrect image configuration
- Kubelet unable to access the image (special handling required for accessing
http://gcr.io/in certain environments) - Incorrect configuration of private image credentials
- Image is too large and exceeds the pull timeout (you can adjust the
image-pull-progress-deadlineandruntime-request-timeoutoptions of kubelet accordingly) - CNI network error, which usually requires checking the configuration of the CNI network plugin, such as:
- Inability to configure the Pod network
- Failure to allocate an IP address
- Container unable to start, which requires checking if the correct image is packaged or if the container parameters are properly configured.
Pod in ImagePullBackOff state
This is usually caused by an incorrect image name configuration or incorrect configuration of the private image’s credentials.
In this situation, you can use docker pull <image> to verify if the image can be pulled successfully.
If it is a private image, you need to first create a Secret of type docker-registry:
kubectl create secret docker-registry my-secret --docker-server=DOCKER_REGISTRY_SERVER --docker-username=DOCKER_USER --docker-password=DOCKER_PASSWORD --docker-email=DOCKER_EMAIL
Then reference this Secret in the container.
spec:
containers:- name: private-reg-container
  image: <your-private-image>
imagePullSecrets:- name: my-secret
Pod is stuck in CrashLoopBackOff state
The CrashLoopBackOff state indicates that the container has started but exited abnormally. In this case, you can first check the logs of the container using the following commands:
kubectl logs <pod-name>
kubectl logs --previous <pod-name>
Here, you can find some reasons for the container’s exit, such as:
- Container process exiting;
- Failure in health checks;
If no clues are found yet, you can also execute commands inside the container to further investigate the exit reason.
kubectl exec cassandra -- cat /var/log/cassandra/system.log
If there are still no clues, you need to SSH into the Node where the Pod is located and check the logs of Kubelet or Docker for further investigation.
To find out which Node the pod is on:
kubectl get pod <pod-name> -o wide
Pod in Error State
Typically, a Pod in an Error state indicates that an error occurred during the Pod startup process. Common reasons include:
- Dependencies such as ConfigMap, Secret, or PV do not exist.
- The requested resources exceed the limits set by the administrator, such as exceeding the LimitRange.
- Violation of cluster security policies, such as violating PodSecurityPolicy.
- The container does not have permission to operate on cluster resources, such as when RBAC is enabled and requires role binding for ServiceAccount.
Pod in Terminating or Unknown State
Kubernetes does not delete Pods running on a Node just because it becomes unreachable. Instead, it marks them as Terminating or Unknown. There are three ways to delete Pods in these states:
- Remove the Node from the cluster. When using a public cloud, kube-controller-manager automatically deletes the corresponding Node after the VM is deleted. In a cluster deployed on physical machines, the administrator needs to manually delete the Node (e.g.,
kubectl delete node <node-name>). - Restore the Node to normal. Kubelet will communicate with kube-apiserver again to confirm the expected state of these Pods and then decide whether to delete or continue running them.
- Force deletion by the user. Users can execute
kubectl delete pods <pod> --grace-period=0 --forceto forcefully delete the Pod. This method should only be used if it is known for certain that the Pod is in a stopped state (e.g., the VM or physical machine on which the Node resides has been shut down). It is not recommended, especially for Pods managed by StatefulSet, as force deletion can lead to split-brain or data loss issues.
V. Kubernetes Troubleshooting Guide - Analyzing Container Exit Status
5.1. Explanation of Pod Status
CrashLoopBackOff: The container exits and kubelet is restarting it.
InvalidImageName: Unable to resolve the image name.
ImageInspectError: Unable to validate the image.
ErrImageNeverPull: Image pulling is prohibited by the policy.
ImagePullBackOff: Retrying to pull the image.
RegistryUnavailable: Unable to connect to the image registry.
ErrImagePull: Generic error while pulling the image.
CreateContainerConfigError: Cannot create the container configuration used by kubelet.
CreateContainerError: Failed to create the container.
m.internalLifecycle.PreStartContainer: Error executing hook.
RunContainerError: Failed to start the container.
PostStartHookError: Error executing hook.
ContainersNotInitialized: Containers have not finished initializing.
ContainersNotReady: Containers are not ready.
ContainerCreating: Container is being created.
PodInitializing: Pod is initializing.
DockerDaemonNotReady: Docker is not fully started yet.
NetworkPluginNotReady: Network plugin is not fully started yet.
5.2. Container Exit Code
5.2.1. Range of Container Exit Codes
- Must be between 0 and 255.
- 0 indicates a normal exit.
- When the program is interrupted by an external factor, the exit code range is 129-255. (The operating system sends an interrupt signal to the program, such as SIGKILL for kill -9, or SIGINT for Ctrl+c)
- The exit code range for abnormal exits caused by program itself is 1-128. (This is just a general convention, programs can also use exit codes 129-255 if necessary). Note: Sometimes we may see exit(-1) in the code, in this case, an automatic conversion will be performed and the final output will still be within the range of 0-255.
The conversion formula for code representing the exit status is as follows:
When the specified exit code is negative, the conversion formula is as follows:
256 - (|code| % 256)
When the specified exit status is a positive number, the conversion formula is as follows:
code % 256
5.2.2, Explanation of Common Container Exit Status Codes
EXIT CODE 0
- Exit code 0 indicates that the specific container does not have any attached foreground processes.
- This exit code is an exception to all other subsequent exit codes.
- This exit code is used when developers want to automatically stop their container after it has completed its work. For example, in Kubernetes, a job has a normal exit code of 0 after completing its task.
EXIT CODE 1
- Program error, or referencing a non-existent file in the Dockerfile, such as referencing an incorrect package in the entrypoint.
- Program errors can be simple, such as “division by zero,” or more complex, such as null references or other program crashes.
EXIT CODE 137
- Indicates that the container received the SIGKILL signal and the process was killed, corresponding to kill -9.
- SIGKILL is triggered by docker kill. This can be initiated by the user or by the Docker daemon. Manually executed: docker kill.
- 137 is quite common. If the limit resources in a pod are set too low, it can result in insufficient memory and lead to OOMKilled. In this case, the value of “OOMKilled” in the state will be true, and you can see the OOM log in dmesg -T.
EXIT CODE 139
- Indicates that the container received the SIGSEGV signal, indicating an invalid memory reference, corresponding to kill -11.
- This is usually caused by code issues or problems with the base image of Docker.
EXIT CODE 143
- Indicates that the container received the SIGTERM signal, indicating that the terminal is closing, corresponding to kill -15.
- Generally corresponds to the docker stop command.
- Sometimes docker stop can also result in Exit Code 137. This occurs when the code is unable to handle SIGTERM, and the Docker process waits for ten seconds before issuing a SIGKILL force exit.
Less Common EXIT CODES
- Exit Code 126: Permission issues or the command is not executable.
- Exit Code 127: Occurs in a shell script when there may be a misspelling or unrecognized characters.
- Exit Code 1 or 255: Many programmers habitually use exit(1) or exit(-1) for abnormal exits, and -1 is converted to 255 according to conversion rules. This is generally a custom code and depends on specific logic.
Reference
https://dbaplus.cn/news-134-5565-1.html