Prometheus Basics
Indicators are used to measure the trend of performance, consumption, efficiency, and many other software properties over time. They allow engineers to monitor the evolution of a range of measured values, such as CPU or memory usage, request duration, latency, etc., through alerts and dashboards. Indicators have a long history in IT monitoring and are widely used by engineers, along with logs and tracing, to detect unexpected system behavior.
In its most basic form, an indicator data point consists of three parts:
- An indicator name
- A timestamp indicating when the data point was collected
- A measurement value represented by a number
Prometheus Indicators
The first thing to do is to understand the four types of indicators that Prometheus collects as part of its exposed format:
- Counters
- Gauges
- Histograms
- Summaries
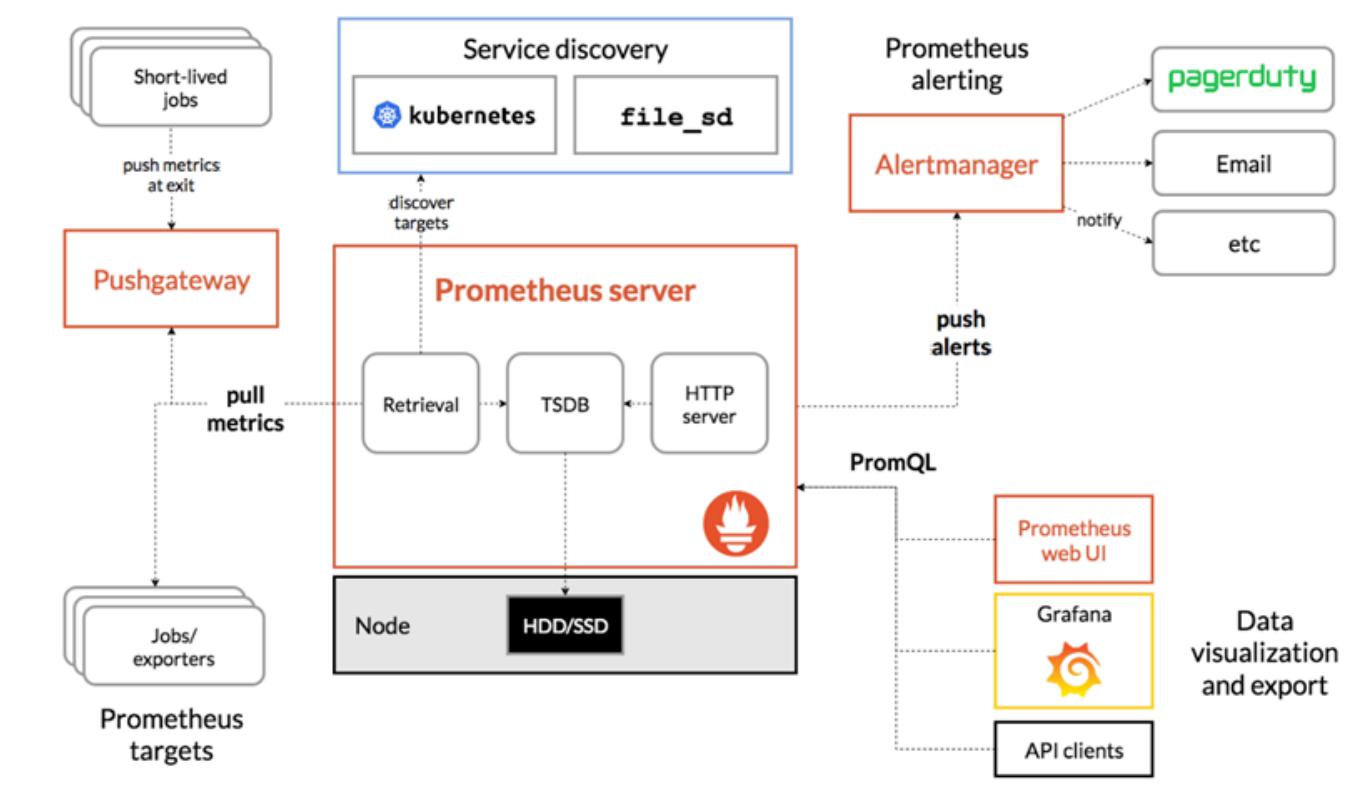
Prometheus uses a pull model to collect these indicators, which means that Prometheus actively fetches the exposed indicator’s HTTP endpoint. These endpoints can be naturally exposed by the monitored components or exposed through one of the hundreds of Prometheus exporters established by the community. Prometheus provides client libraries for different programming languages that you can use to monitor your code.
Due to the service discovery mechanism and shared network access within the cluster, the pull model works well when monitoring a Kubernetes cluster, but it can be challenging to monitor dynamic virtual machine clusters, AWS Fargate containers, or Lambda functions with Prometheus. The main reason is that transactions determine the endpoints of the indicators to be fetched, and access to these endpoints may be restricted by network security policies. To address some of these issues, the community released Prometheus Agent Mode at the end of 2021, which only collects indicators and sends them to the monitoring backend using a remote write protocol.
Prometheus can fetch indicators in Prometheus exposed format and OpenMetrics format. In both cases, the indicators are exposed through an HTTP interface, using a simple text-based format (more commonly used and widely supported) or a more efficient and powerful Protobuf format. One major advantage of the text format is its readability, which means that you can open it in a browser or retrieve the currently exposed set of indicators using tools like curl.
Prometheus uses a very simple indicator model, with four indicator types that are only supported in the client SDK. All indicator types are represented in the exposed format using a data type that is either a single data type or a combination of multiple single data types. This data type includes an indicator name, a set of labels, and a floating-point number. The timestamp is added by the monitoring backend (such as Prometheus) or the proxy when fetching the indicator.
Each unique combination of indicator name and label set defines a time series, and each timestamp and floating-point number defines a sample (i.e., a data point) in a series.
Some conventions are used to represent different types of measurements. A very useful feature of the Prometheus exposed format is the ability to associate metadata with a measurement to define its type and provide a description. For example, Prometheus provides this information and Grafana uses it to display additional contextual information to users, helping them to choose the right measurement and apply the correct PromQL functions.
The indicator browser in Grafana displays a list of Prometheus indicators and provides additional context about those indicators.
Here is an example of an indicator exposed using the Prometheus exposed format.
# TYPE http_requests_total counter
http_requests_total{api="add_product"} 4633433
# HELP provides a description for the indicator, and # TYPE specifies the type of the indicator.
Now, let’s take a closer look at each type of Prometheus indicator.
Counters
Counter-type indicators are used for monotonically increasing measurement results. Therefore, they always have cumulative values, and the value can only go up. The only exception is Counter restarts, in which case its value is reset to zero.
The actual value of a counter is often not very useful by itself. The value of a counter is often used to calculate the delta between two timestamps or the rate of change over time. For example, a typical use case of a counter is to record the number of API calls, which is a measurement value that always increases.
# TYPE http_requests_total counter
http_requests_total{api="add_product"} 4633433
The indicator name is http_requests_total, it has a tag named api with a value of add_product, and the counter value is 4633433. This means that the add_product API has been called 4633433 times since the last service start or counter reset. As a convention, counter-type indicators are usually suffixed with _total.
This absolute number does not provide us with much information, but when used with the rate function of PromQL (or similar functions of other monitoring backends), it can help us understand the number of requests per second received by that API. The following PromQL query calculates the average number of requests per second over the past 5 minutes:
rate(http_requests_total{api="add_product"}[5m])
To calculate the absolute change over a period, we will use the delta function, called increase() in PromQL:
increase(http_requests_total{api="add_product"}[5m])
This will return the total number of requests made over the past 5 minutes, which is equivalent to the rate per second multiplied by the number of seconds in the interval (in our example, 5 minutes):
rate(http_requests_total{api="add_product"}[5m]) * 5 * 60
Other examples where you might use counter-type indicators include measuring the number of orders on an e-commerce website, the number of bytes sent and received on a network interface, or the number of errors in an application. If it is a measurement that always increases, then use a counter.
Here is an example of how to create and increment a counter indicator in Python using the Prometheus client library:
api_requests_counter = Counter(
                    'http_requests_total',
                    'Total number of http api requests',
                    ['api']
                   )
api_requests_counter.labels(api='add_product').inc()
It is important to note that because counters can be reset to zero, you need to make sure that the backend you use to store and query indicators can handle this and still provide accurate results in case of a counter restart. Prometheus and compatible PromQL remote storage systems, such as Promscale, can handle counter restarts correctly.
Gauges
Gauge indicators are used for measurements that can increase or decrease arbitrarily. This is a type of indicator that you may be more familiar with, because even the actual value without additional processing is meaningful and is often used. For example, indicators that measure temperature, CPU and memory usage, or the size of a queue are all gauges.
For example, to measure the memory usage of a host, we can use a gauge indicator, such as:
# TYPE node_memory_used_bytes gauge
node_memory_used_bytes{hostname="host1.domain.com"} 943348382
The above indicator indicates that at the time of measurement, the node host1.domain.com was using about 900 MB of memory. The value of the indicator is meaningful and does not require any additional calculation, as it tells us how much memory is consumed on that node.
Unlike with counter-type indicators, rate and delta functions do not make sense with gauges. However, functions that calculate the average, maximum, minimum, or percentiles of a specific time series are often used with gauges. In Prometheus, the names of these functions are avg_over_time, max_over_time, min_over_time, and quantile_over_time. To calculate the average memory used on host1.domain.com over the past 10 minutes, you can do the following:
avg_over_time(node_memory_used_bytes{hostname="host1.domain.com"}[10m])
To create a gauge indicator using the Prometheus client library in Python, you can do the following:
memory_used = Gauge(
            'node_memory_used_bytes',
            'Total memory used in the node in bytes',
            ['hostname']
          )
memory_used.labels(hostname='host1.domain.com').set(943348382)
Histogram
Histogram metrics are useful for representing the distribution of measurements. They are often used to measure request duration or response size.
Histogram divides the entire measurement range into a set of intervals called buckets and calculates how many measurement values are in each bucket.
A histogram metric includes several items:
- A counter containing the number of measurements. The metric name uses the
_countsuffix. - A counter containing the sum of all measurement values. The metric name uses the
_sumsuffix. - Histogram buckets are exposed as a series of counters, using the suffix
_bucketof the metric name and thele labelindicating the upper limit of the bucket. In Prometheus, buckets include the boundaries of the bucket, so a bucket with an upper limit of N (i.e.,le label) includes all data points with values less than or equal to N.
For example, a Histogram metric that measures the response time of the add_product API endpoint instance running on host1.domain.com can be represented as:
# HELP http_request_duration_seconds Api requests response time in seconds
# TYPE http_request_duration_seconds histogram
http_request_duration_seconds_sum{api="add_product" instance="host1.domain.com"} 8953.332
http_request_duration_seconds_count{api="add_product" instance="host1.domain.com"} 27892
http_request_duration_seconds_bucket{api="add_product" instance="host1.domain.com" le="0"}
http_request_duration_seconds_bucket{api="add_product", instance="host1.domain.com", le="0.01"} 0
http_request_duration_seconds_bucket{api="add_product", instance="host1.domain.com", le="0.025"} 8
http_request_duration_seconds_bucket{api="add_product", instance="host1.domain.com", le="0.05"} 1672
http_request_duration_seconds_bucket{api="add_product", instance="host1.domain.com", le="0.1"} 8954
http_request_duration_seconds_bucket{api="add_product", instance="host1.domain.com", le="0.25"} 14251
http_request_duration_seconds_bucket{api="add_product", instance="host1.domain.com", le="0.5"} 24101
http_request_duration_seconds_bucket{api="add_product", instance="host1.domain.com", le="1"} 26351
http_request_duration_seconds_bucket{api="add_product", instance="host1.domain.com", le="2.5"} 27534
http_request_duration_seconds_bucket{api="add_product", instance="host1.domain.com", le="5"} 27814
http_request_duration_seconds_bucket{api="add_product", instance="host1.domain.com", le="10"} 27881
http_request_duration_seconds_bucket{api="add_product", instance="host1.domain.com", le="25"} 27890
http_request_duration_seconds_bucket{api="add_product", instance="host1.domain.com", le="+Inf"} 27892
The example above includes sum, counter and 12 buckets. sum and counter can be used to calculate the average value of a measurement over time. In PromQL, the average request response time over the past 5 minutes can be calculated as follows:
rate(http_request_duration_seconds_sum{api="add_product", instance="host1.domain.com"}[5m]) / rate(http_request_duration_seconds_count{api="add_product", instance="host1.domain.com"}[5m])
It can also be used to calculate the average of multiple time series. The following PromQL query calculates the average request response time for all APIs and instances over the past 5 minutes:
sum(rate(http_request_duration_seconds_sum[5m])) / sum(rate(http_request_duration_seconds_count[5m]))
With Histogram, you can calculate percentiles for individual time series as well as multiple time series in a query. In PromQL, we use the histogram_quantile function. Prometheus uses quantiles instead of percentiles. They are essentially the same, but represented as a ratio from 0 to 1, while percentiles are represented as a ratio from 0 to 100. To calculate the 99th percentile (0.99 quartile) of the response time of the add_product API running on host1.domain.com, you can use the following query:
histogram_quantile(0.99, rate(http_request_duration_seconds_bucket{api="add_product", instance="host1.domain.com"}[5m]))
One major advantage of Histograms is that they can be aggregated. The following query returns the 99th percentile of response time for all APIs and instances:
histogram_quantile(0.99, sum by (le) (rate(http_request_duration_seconds_bucket[5m])))
In cloud-native environments, there are often multiple instances of the same component running, and being able to aggregate data across instances is key.
There are three main disadvantages of Histograms:
- First, buckets must be predefined, which requires some upfront design. If your buckets are not well defined, you may not be able to calculate the percentiles you need, or consume unnecessary resources. For example, if you have an API that always takes longer than one second, then having buckets with an upper limit (
le label) less than one second would be useless and only consume computing and storage resources on the monitoring backend server. On the other hand, if 99.9% of API requests take less than 50 milliseconds, having an initial bucket with an upper limit of 100 milliseconds will not accurately measure the performance of the API. - Second, they provide approximate percentiles, not exact ones. This is usually not a problem as long as your buckets are designed to provide reasonably accurate results.
- Third, since percentiles need to be calculated on the server side, their computation cost can be very high when dealing with large amounts of data. One way to mitigate this in Prometheus is to use recording rules (
https://prometheus.io/docs/prometheus/latest/configuration/recording_rules/) to pre-calculate the percentiles you need.
The following example shows how to create a Histogram metric with custom buckets using Prometheus’ Python client library.
from prometheus_client import Histogram
api_request_duration = Histogram(
                        name='http_request_duration_seconds',
                        documentation='Api requests response time in seconds',
                        labelnames=['api', 'instance'],
                        buckets=(0.01, 0.025, 0.05, 0.1, 0.25, 0.5, 1, 2.5, 5, 10, 25 )
                       )
api_request_duration.labels(
api='add_product',
instance='host1.domain.com'
).observe(0.3672)
Summary
Like Histograms, Summary metrics are useful for measuring request duration and response size.
Summary metrics include these metrics:
- A counter containing the total number of measurements. The metric name uses the
_countsuffix. - A counter containing the sum of all measurement values. The metric name uses the
_sumsuffix. You can optionally use metric names with percentile labels to expose percentile metrics for certain measurement values. Since you do not want these values to be measured over the entire time your application is running, Prometheus client libraries usually use streaming percentile values, which are calculated over a sliding (usually configurable) time window.
For example, a Summary metric that measures the response time of the add_product API endpoint instance running on host1.domain.com can be represented as:
# HELP http_request_duration_seconds Api requests response time in seconds
# TYPE http_request_duration_seconds summary
http_request_duration_seconds_sum{api="add_product" instance="host1.domain.com"} 8953.332
http_request_duration_seconds_count{api="add_product" instance="host1.domain.com"} 27892
http_request_duration_seconds{api="add_product" instance="host1.domain.com" quantile="0"}
http_request_duration_seconds{api="add_product" instance="host1.domain.com" quantile="0.5"} 0.232227334
http_request_duration_seconds{api="add_product" instance="host1.domain.com" quantile="0.90"} 0.821139321
http_request_duration_seconds{api="add_product" instance="host1.domain.com" quantile="0.95"} 1.528948804
http_request_duration_seconds{api="add_product" instance="host1.domain.com" quantile="0.99"} 2.829188272
http_request_duration_seconds{api="add_product" instance="host1.domain.com" quantile="1"} 34.283829292
The above example includes the sum, count, and five percentiles. Percentile 0 is equivalent to the minimum value, percentile 1 is equivalent to the maximum value. Percentile 0.5 is the median, percentiles 0.90, 0.95, and 0.99 are equivalent to the 90th, 95th, and 99th percentiles of the response time of the add_product API endpoint running on host1.domain.com.
Like Histograms, Summary metrics include the sum and count, which can be used to calculate the average value over time and the average value of different time series.
Summary provides more accurate percentile calculation results than Histograms, but these percentiles have three main disadvantages:
- First, client-side percentile calculation is expensive. This is because the client library must maintain a sorted list of data points to perform this calculation. Implementations in the Prometheus SDK limit the number of data points kept in memory and sorted for this calculation, reducing accuracy in exchange for efficiency. Note that not all Prometheus client libraries support percentile values in summary metrics. For example, the Python SDK does not support them.
- Second, the value you want to query must be defined in advance by the client. Only those values that have provided metrics can be returned by the query. There is no way to calculate other percentiles in the query. Adding a new percentile metric requires modifying the code before the metric can be used.
- Third, and most importantly: it is impossible to aggregate multiple Summary metrics.
Histogram or Summary?
In most cases, a histogram is preferred because it is more flexible and allows for summarizing percentiles.
However, summaries are useful in cases where only the mean is needed or when very precise percentiles are required. For example, when fulfilling contractual obligations for critical systems.
Reference
- Basic Getting Started Document for psql:
https://prometheus.io/docs/prometheus/latest/querying/basics/ - Documentation for Related Functions in psql:
https://prometheus.io/docs/prometheus/latest/querying/functions/ - Documentation for psql Operations Introduction:
https://prometheus.io/docs/prometheus/latest/querying/operators/ https://www.timescale.com/blog/four-types-prometheus-metrics-to-collect/