Monitoring
Introduction
Monitoring is the practice of collecting and analyzing data about the performance and behavior of a computer system or application. It is a critical aspect of maintaining the reliability and availability of any software system. By monitoring a system, one can detect and diagnose issues, identify trends, and optimize performance.
There are several different types of monitoring, including:
- Resource monitoring: This involves collecting data about the system’s resources, such as CPU usage, memory usage, and network bandwidth. This information can be used to identify bottlenecks and optimize performance.
- Performance monitoring: This involves collecting data about the application’s performance, such as response time, throughput, and error rates. This information can be used to identify and diagnose issues and optimize performance.
- Event monitoring: This involves collecting data about specific events that occur within the system, such as system log messages and application log messages. This information can be used to identify and diagnose issues and understand how the system is behaving.
- Availability monitoring: This involves checking the system’s availability by pinging the application or website to ensure that it is up and running. This information can be used to ensure that the system is always available and that any issues are detected and resolved quickly.
When monitoring a system, it’s important to consider the following best practices:
- Use an appropriate monitoring tool: There are many monitoring tools available, such as Prometheus, Nagios, and Zabbix, each with its own strengths and weaknesses. It’s important to choose a tool that is appropriate for your specific needs.
- Collect relevant data: It’s important to collect the right data to understand how the system is behaving. This may include resource usage, performance metrics, and event logs.
- Automate alerting: It’s important to set up automatic alerts so that any issues are detected and resolved as quickly as possible.
- Store and analyze the data: Storing and analyzing the data collected by monitoring tools can help identify trends and patterns that can be used to optimize performance and prevent issues.
- Test and validate the monitoring: It’s important to test and validate the monitoring system to ensure that it’s working as expected and that the data it’s collecting is accurate.
Cloud Monitoring
Cloud monitoring is the practice of collecting and analyzing data about the performance and behavior of cloud-based applications and services. It is a critical aspect of maintaining the reliability and availability of any cloud-based system. By monitoring a cloud-based system, one can detect and diagnose issues, identify trends, and optimize performance.
There are several different types of cloud monitoring, including:
- Resource monitoring: This involves collecting data about the system’s resources, such as CPU usage, memory usage, and network bandwidth. This information can be used to identify bottlenecks and optimize performance.
- Performance monitoring: This involves collecting data about the application’s performance, such as response time, throughput, and error rates. This information can be used to identify and diagnose issues and optimize performance.
- Event monitoring: This involves collecting data about specific events that occur within the system, such as system log messages and application log messages. This information can be used to identify and diagnose issues and understand how the system is behaving.
- Availability monitoring: This involves checking the system’s availability by pinging the application or website to ensure that it is up and running. This information can be used to ensure that the system is always available and that any issues are detected and resolved quickly.
When monitoring a cloud-based system, it’s important to consider the following best practices:
- Use an appropriate monitoring tool: There are many monitoring tools available, such as Prometheus, Nagios, and Zabbix, each with its own strengths and weaknesses. It’s important to choose a tool that is appropriate for your specific needs.
- Collect relevant data: It’s important to collect the right data to understand how the system is behaving. This may include resource usage, performance metrics, and event logs.
- Automate alerting: It’s important to set up automatic alerts so that any issues are detected and resolved as quickly as possible.
- Store and analyze the data: Storing and analyzing the data collected by monitoring tools can help identify trends and patterns that can be used to optimize performance and prevent issues.
- Test and validate the monitoring: It’s important to test and validate the monitoring system to ensure that it’s working as expected and that the data it’s collecting is accurate.
In conclusion, monitoring is a critical aspect of maintaining the reliability and availability of any software system. By collecting and analyzing data about the system’s performance and behavior, one can detect and diagnose issues, identify trends, and optimize performance. Choosing the right monitoring tool, collecting relevant data, automating alerting, storing and analyzing the data and validating the monitoring system are the best practices to follow.
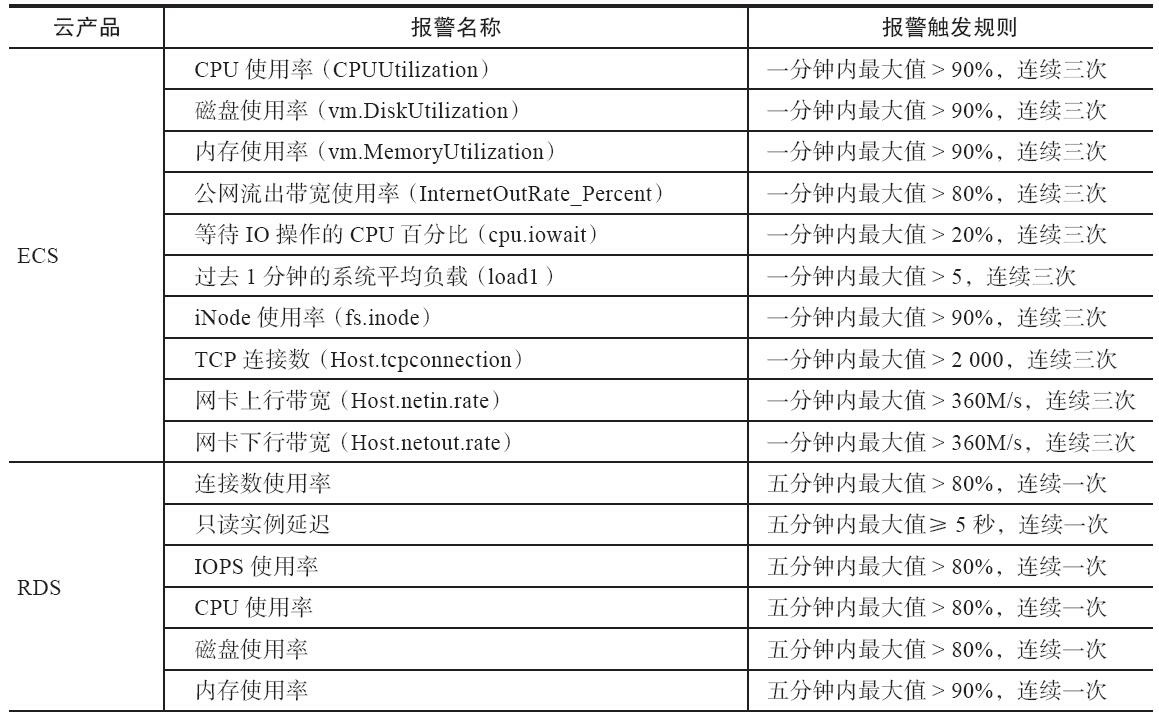
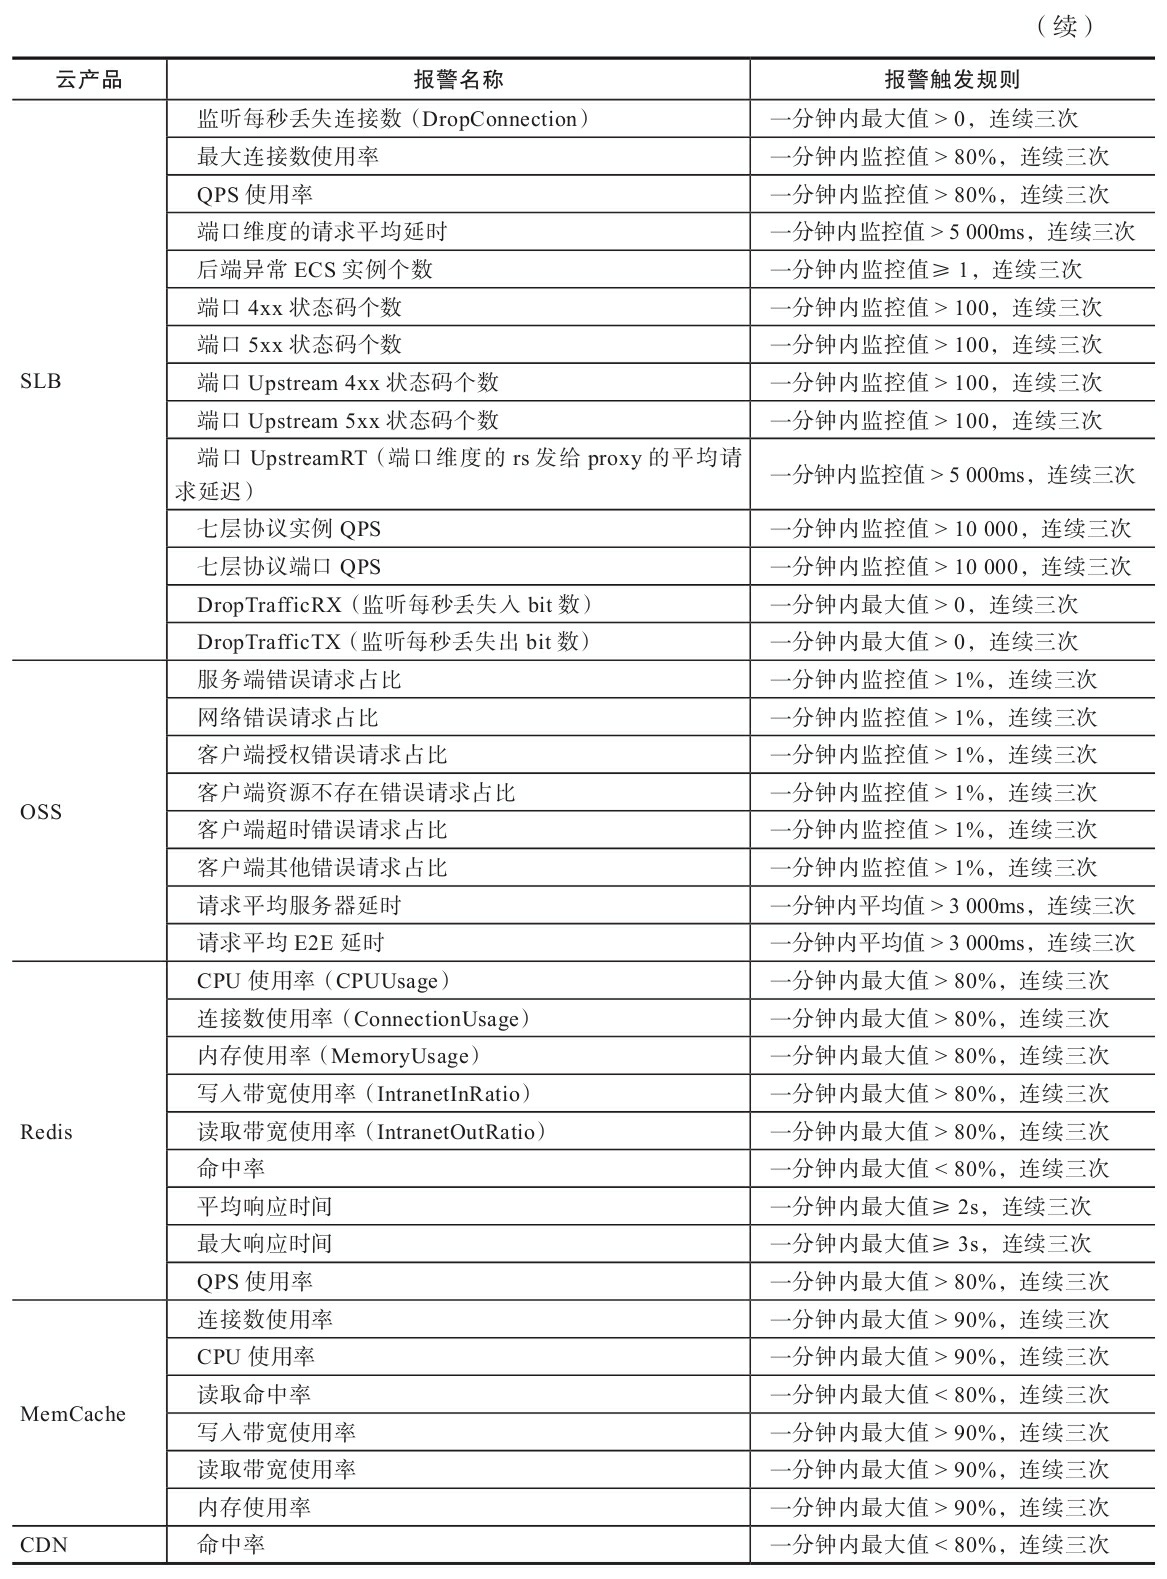
Key Metrics
Cluster health metrics
- Number of nodes
- Node health status
- Number of Pods per node, and overall
- Resource usage/allocation per node, and overall
Deployment metrics
- Number of deployments
- Number of configured replicas per deployment
- Number of unavailable replicas per deployment
Container metrics
- Number of containers/Pods per node, and overall
- Resource usage for each container against its requests/limits
- Liveness/readiness of containers
- Number of container/Pod restarts
- Network in/out traffic and errors for each container
Application metrics
- Number of messages received
- Number of successfully processed messages
- Number of invalid or erroneous messages
- Time to process and act on each message
- Number of successful actions generated
- Number of failed actions
- Requests received
- Errors returned
- Duration (time to handle each request)
Runtime metrics
- Number of processes/threads/goroutines
- Heap and stack usage
- Nonheap memory usage
- Network/I/O buffer pools
- Garbage collector runs and pause durations (for garbage-collected languages)
- File descriptors/network sockets in use
Modern Monitoring System
Monitoring
- Datadog
- falcon
- nightingale (
https://github.com/didi/nightingale) - zabbix
- netdata
- telegraf+influxdb/kapacitor+chronograph
- metricbeat+elasticsearch
- prometheus
- Google Stackdriver
- AWS Cloudwatch
- Azure Monitor
- New Relic
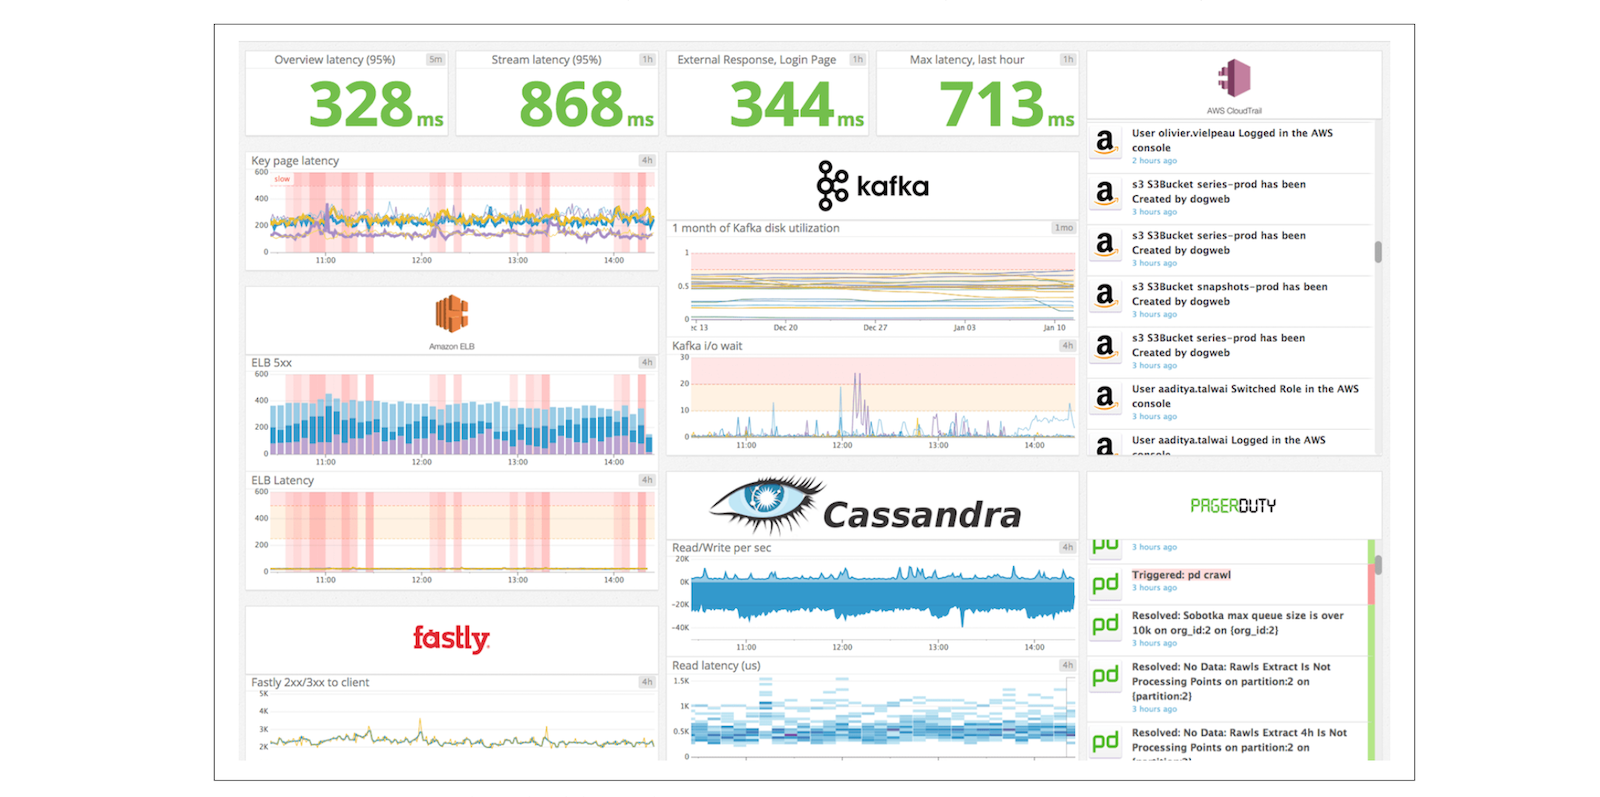
Dashboard
- Granafa
- Graphite
- Zeppelin
- Kibana
Reference
- What is Monitoring? (
https://www.datadoghq.com/blog/observability/) - 阿里云运维架构实践秘籍(乔锐杰)